Ranked by Euclidean distance across stack, reach, head-tube angle, mechanical trail, chainstay length, wheelbase, and bottom-bracket drop — all z-scaled so no metric dominates.
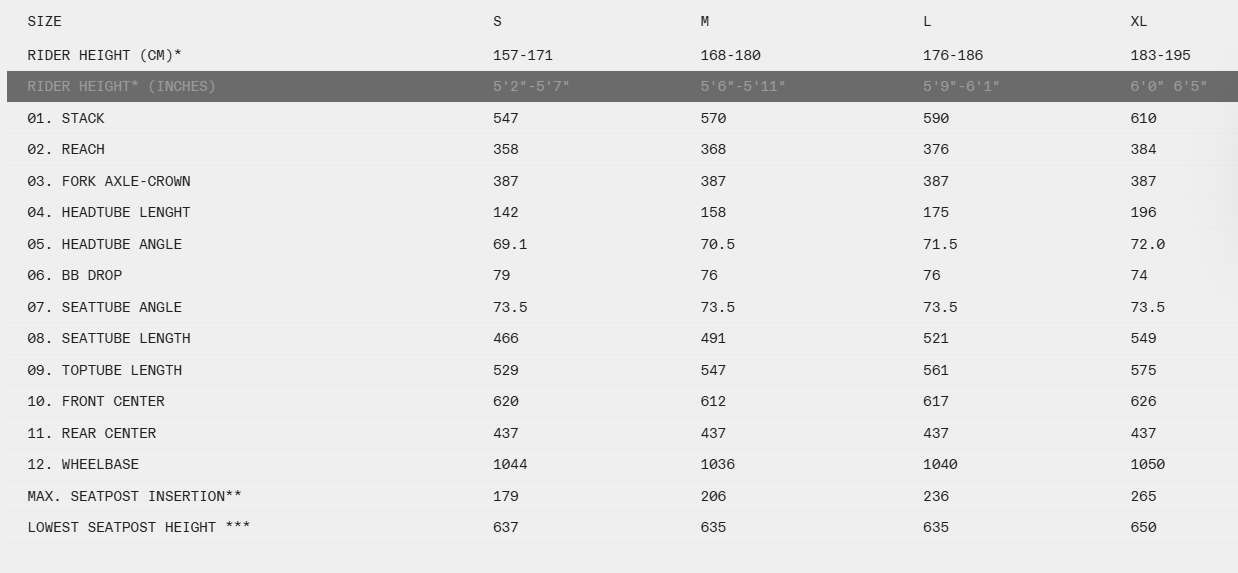
| Stack | 580 mm | Reach | 382 mm |
|---|---|---|---|
| Head-tube angle | 71.0 ° | Trail | 62.8 mm |
| Chainstay | 437 mm | Wheelbase | 1049 mm |
| BB drop | 76 mm | Type | Gravel |
| # | Bike | Δ | Stack | Reach | HTA | Trail | WB |
|---|---|---|---|---|---|---|---|
| 1 | Pinarello Granger 2026 | 1.79 | 581 mm | 387 mm | 70.6 ° | 72.1 mm | 1041 mm |
| 2 | Allied Able 2026 | 1.87 | 565 mm | 397 mm | 70.5 ° | 67.7 mm | 1055 mm |
| 3 | Trek Checkpoint 2026 | 1.91 | 590 mm | 395 mm | 71.8 ° | 66.0 mm | 1039 mm |
| 4 | Niner RLT 9 RDO 2026 | 2.02 | 584 mm | 379 mm | 71.3 ° | 73.3 mm | 1024 mm |
| 5 | Moots Routt RSL 2026 | 2.18 | 577 mm | 384 mm | 70.5 ° | 78.0 mm | 1045 mm |
| 6 | Pinarello Grevil F 2026 | 2.29 | 580 mm | 393 mm | 71.3 ° | 65.4 mm | 1048 mm |
| 7 | Canyon Grizl CF 2026 | 2.30 | 595 mm | 405 mm | 71.0 ° | 66.5 mm | 1077 mm |
| 8 | Salsa Flyway C 2026 | 2.50 | 580 mm | 399 mm | 70.5 ° | 70.9 mm | 1049 mm |
Across the 8 closest matches in the catalog the 3T Extrema Italia 2026 fits a recognisable cluster of Gravel bikes. The neighbour set was selected only from the same bike-type bucket and only from models for which we have a full stack/reach/HTA/trail/chainstay/wheelbase/BB-drop record — so the distance numbers above are like-for-like, not apples-to-oranges.
The single closest geometric match is the Pinarello Granger 2026, with a normalised distance of 1.5 mm of stack and 4.4 mm of reach separating the two. Riders who liked the position of one will almost always feel at home on the other.
The 3T Extrema Italia 2026 sits almost exactly on the stack mean for this peer set, which is a strong signal that the brand built it to a familiar template rather than chasing a niche fit.
3T Extrema Italia 2026 runs about 10.1 mm less reach than the median of its closest neighbours, so the cockpit is shorter than its peers, which packs the rider over the bottom bracket and suits classic stem lengths.
3T Extrema Italia 2026 runs about 7.2 mm less trail than the median of its closest neighbours, so the steering is lighter and more responsive than its peers — better for technical handling, crit corners, and trials-style movement.
Use the side-by-side comparison links below to drill in on any specific pairing. Every comparison page on RideDNA is computed from the same audited geometry tables that power this list, so the numbers will be internally consistent. If you'd rather start from your existing fit, the Fit Wizard takes a few of your current bike's measurements and re-runs this same nearest-neighbour search from your seat, not from a brand the manufacturer chose to compete with.
Method. Each of the seven metrics is z-scaled by its standard deviation across the candidate pool before being summed in the Euclidean norm. This avoids wheelbase (typically ±50 mm of variation) drowning out HTA (±2° of variation). We deliberately do not include subjective scores in this similarity calculation — the goal is geometric kinship, not handling kinship. Two bikes that share geometry but pair it with very different fork offsets or tyre clearances can still feel different on the trail; the Handling Index page is the better tool for that question.