A size-by-size geometry profile with manufacturer provenance and RideDNA consistency-audit context. Use the complete table to compare fit and handling before opening the interactive tools.
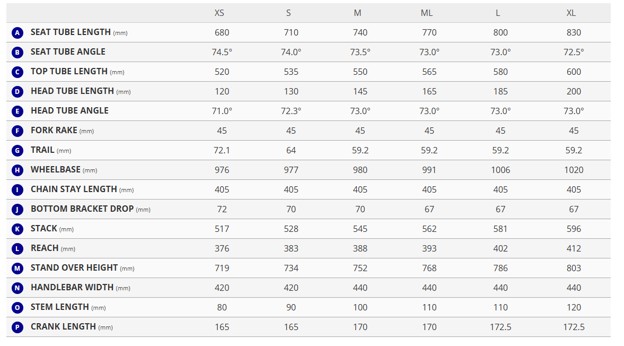
Source: Manufacturer geometry source
Provenance: published is present in the manufacturer data; derived is calculated by RideDNA; manual is a staff-entered reference rather than a manufacturer-chart value. “Not published” means the manufacturer did not provide a value for that size.
| Size | Stack | Reach | HTA | STA | ETT | Chainstay | Wheelbase | Front center | BB drop | Trail | Fork offset | Audit context |
|---|---|---|---|---|---|---|---|---|---|---|---|---|
| L | 581 mm published | 402 mm published | 73.0 ° derived | 73.0 ° derived | 580 mm derived | 405 mm derived | 1006 mm published | 610 mm derived | 67 mm derived | 59.2 mm published | 45 mm published | green |
| All 4 consistency checks passed | ||||||||||||
| M | 545 mm published | 388 mm published | 73.0 ° derived | 73.5 ° derived | 550 mm derived | 405 mm derived | 980 mm published | 585 mm derived | 71 mm derived | 58.4 mm published | 45 mm published | green |
| All 4 consistency checks passed | ||||||||||||
| ML | 562 mm published | 393 mm published | 73.0 ° derived | 73.0 ° derived | 565 mm derived | 405 mm derived | 991 mm published | 596 mm derived | 66 mm derived | 58.4 mm published | 45 mm published | green |
| All 4 consistency checks passed | ||||||||||||
| S | 528 mm published | 383 mm published | 72.3 ° derived | 74.0 ° derived | 535 mm derived | 405 mm derived | 977 mm published | 581 mm derived | 71 mm derived | 63.5 mm published | 45 mm published | green |
| All 4 consistency checks passed | ||||||||||||
| XL | 596 mm published | 412 mm published | 73.0 ° derived | 72.5 ° derived | 600 mm derived | 405 mm derived | 1020 mm published | 625 mm derived | 67 mm derived | 59.2 mm published | 45 mm published | green |
| All 4 consistency checks passed | ||||||||||||
| XS | 517 mm published | 376 mm published | 71.0 ° derived | 74.5 ° derived | 520 mm derived | 405 mm derived | 976 mm published | 582 mm derived | 71 mm derived | 71.1 mm published | 45 mm published | green |
| All 4 consistency checks passed | ||||||||||||
Overall consistency: green. This context is shown alongside the table so a rider can distinguish a complete published specification from a value that RideDNA had to derive or could not independently verify.
The Giant TCR Advanced published geometry reconciles within ±1mm engineering tolerance across all six sizes for stack, reach, and wheelbase. Trail shows discrepancies ranging from 1.2mm to 2.0mm, all within ±1mm engineering tolerance. The RideDNA Geometry Engine reconciliation checks reveal a systematic stack mispublishing pattern across four sizes (XS, S, M, ML), where published stack values appear inflated by approximately 1.5mm relative to what the other published geometry parameters imply. One data quality flag warrants attention: size XS shows STA > HTA (74.5° vs 71°), opposite to the dominant pattern across the other five sizes — this minority inversion may indicate an HTA↔STA data entry swap and a vision re-audit of that size is strongly recommended.